Lucky Like a Fox?
In amongst the David vs Goliath life and business lessons being expounded on the back of Leicester’s magnificent Premier League victory, a big question bothers me. It’s a question someone asked when I was pontificating about why some companies became market leaders. He said, “How do you know they weren’t just lucky?”
It seems a pertinent question in football, where opposing teams often have goal scoring chances in the teens but most games are either drawn or decided by a single goal. The best team doesn’t always win, but much of this good and bad fortune cancels itself out over a long season.
The puzzle to decipher with Leicester then is what was luck versus, say, what was work ethic, organisation and ability, in a game that has all of these in ways that are often difficult to separate.
What Does a Lucky Winner Look Like?
To help clear the muddy waters, here’s my definition of a lucky winner: to win you need everything that has a strong element of randomness to go your way. I.e. wherever things can easily go right or wrong, you only win if they all go right, and you have no room for redundancy.
We can apply this to facts about football performance in 4 steps:
- How much pressure the team puts on the opponent’s goal (shots and corners)
- How much of that pressure turns into genuine chances (shots on goal)
- How many of those chances you or your opponents convert (goals)
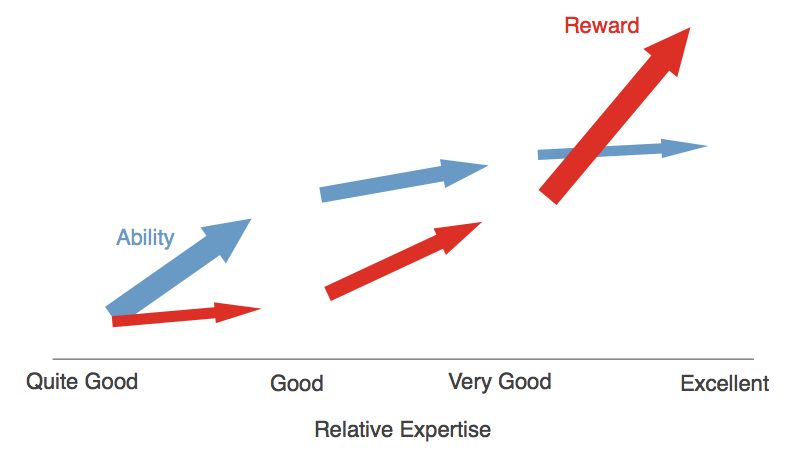
- The reward you get for those goals (points)
Let’s look at each of these steps, taking a view on how much randomness there is, how Leicester fared, and whether they were lucky winners.
Leicester Under a Little Pressure
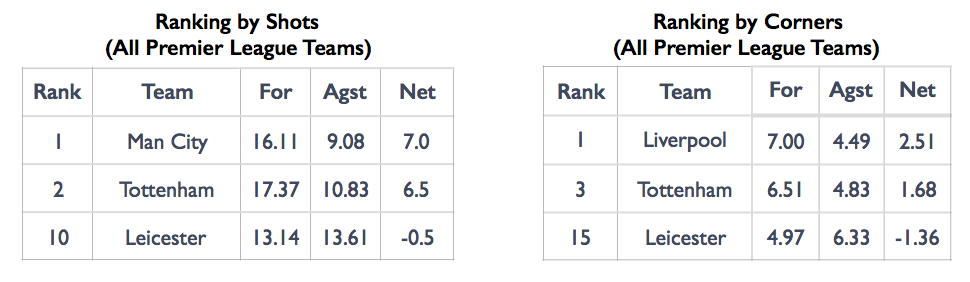
It’s hard to argue that the pressure a team applies or experiences is random. It seems to be about ability, organisation and work; and Leicester were about average on this measure. Leicester suffered slightly more pressure than they applied. In a league table of pressure, of shots and corners, Leicester are in the bottom half. Tottenham, Leicester’s main rivals for the title for most of the season, are 2nd or 3rd.
Things are going to have to go pretty well to get Leicester to the top of the table from here.
Accurate Artillery
Things start going well for Leicester in front of goal, turning those shots into shots on target. Hitting the target seems to be about ability and not luck, and Leicester’s strikers are a tiny bit better than average.
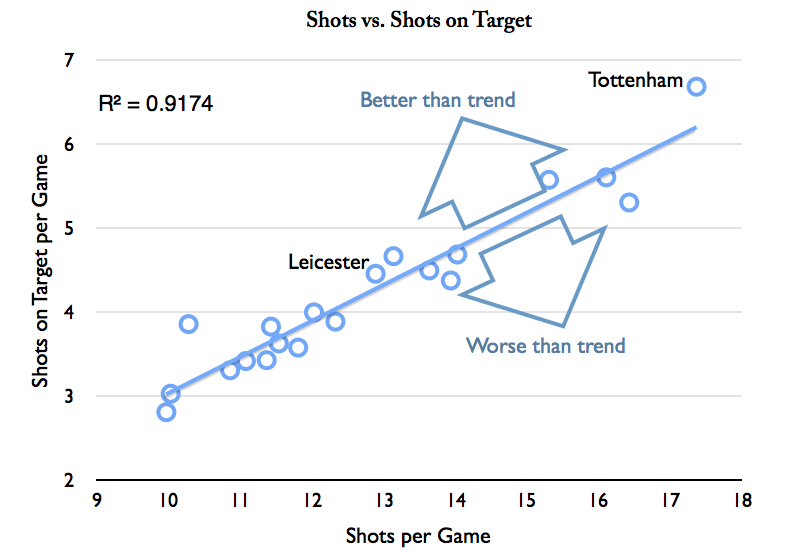
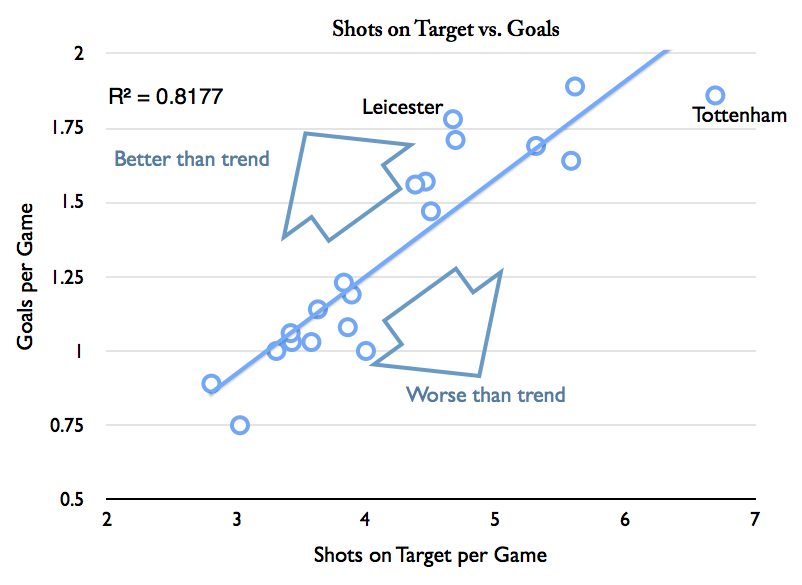
When it comes to turning those shots on target into goals, Leicester’s strikers are the best in the League, beating the trend by quite a long way. It takes some skill to hit the target and beat the keeper in the split seconds available at the top level, but surely there’s an aspect of fortune in hitting the right spot during the maelstrom, defenders being there to block it, or the opposition keeper being well placed and reacting. It seems harsh to judge this superior performance in front of goal as mainly down to luck, but Leicester’s centre forward is beating the trend, by quite a long way, compared to some world class goal scorers.
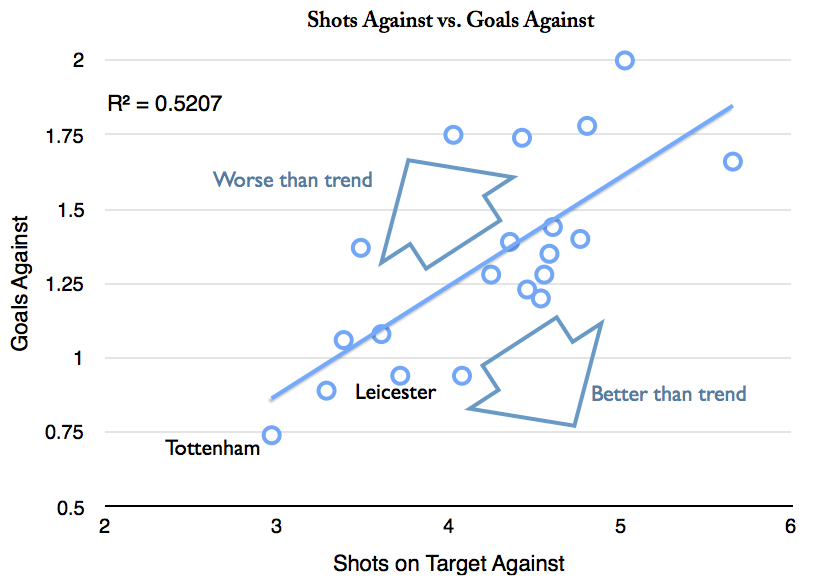
Super Stopper
In defence, Leicester beat the trend, again by quite a long way, Leicester’s opponents being poor at turning chances into goals against Leicester. Is Leicester’s keeper, Kasper Schmeichel, who Leeds sold to Leicester because of a poor goals against record, the third best in a League? One that contains the national keepers of England, France, Spain, Belgium and Czech Republic? Is this all superior skill, or was there a little bit of blessed good fortune in amongst the goalmouth maelstrom?
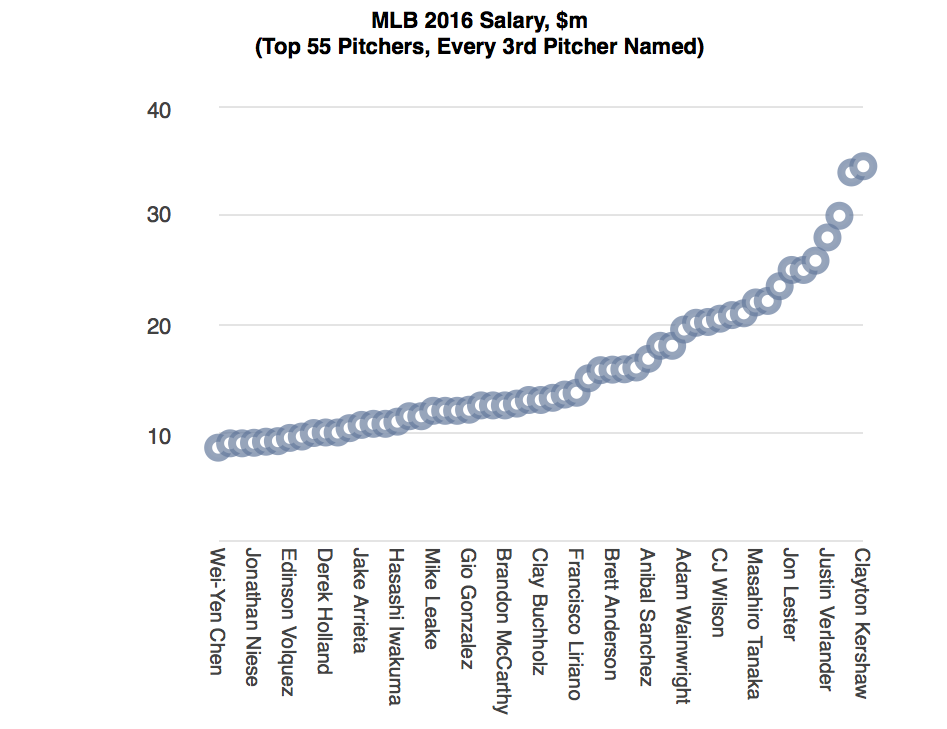
Not All Goals Are Equal
If there were a Premier League for goals for and against, Leicester would have been 3rd. So how come they won it with 2 games to spare? This is because of a points system where you get 3 points for a win, whether you win by 1, 2 or 10 goals. If you score 3 goals in 3 games, you could get three 1-0 wins, which is worth a lot more than one 3-0 win and two 0-0 draws. Of Leicester’s 19 victories when they won the title, 14 were by a single goal. Have a look at a table of average winning margin, comparing good teams and poorer teams. The teams in green finished in the top half of the League, red in the bottom half.
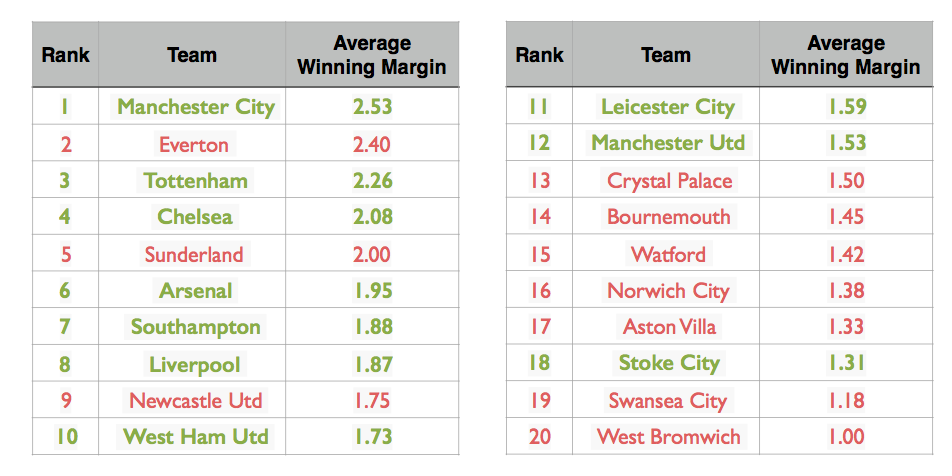
This is a common pattern in many sports: top teams have high average margins of victory, i.e. they often win easily; but weaker teams only just win when they do win, and so have smaller winning margins. Top teams have redundancy in their victories, lesser teams have hardly any. Leicester’s average goals per game is one of the lowest of any top division champions since the second world war.
So Was it Luck Then?
So how much of Leicester’s Premiership was luck? I think it helped quite a bit. Leicester were OK at putting opponents under pressure but no better, and so pretty much everything else had to go in their favour to win the league, which it did from conversion of chances to their large proportion of single goal victories. When everything has to go right, with little room for redundancy, that’s my definition of a lucky winner.
If you don’t believe me, have a look at what the manager said when asked whether he could follow this up with another Premier League title:
“No. Next season we have to fight for 10th position. We have to make sure we are safe then we look to something more.”
No one in his club accused him of talking down the team.
Of course, it wasn’t all about luck. Leicester’s centre forward, Jamie Vardy, did not look out of place when called up to play for England; their winger, Riyad Mahrez, was voted by his fellow professionals as their player of the season. You don’t create the chances to win the Premier League without outstanding ability.
I take a couple of lessons from all this. First, thank goodness, fortune sometimes smiles on David enough for him to beat Goliath. Second, before praising and picking up top tips from winners, or condemning and criticising losers, maybe take a moment to see if someone was in or out of luck that day.