
There’s a truism that gets passed around before Rugby World Cups, when journalists analyse the squads being selected by their national coaches. Here’s an example of it from the Guardian about the Australian squad:
Cheika’s squad hits the key metrics that have mattered most at the World Cup to date – average age and number of Test caps. The 2015 World Cup Wallabies boast a combined 1236 caps, with an average playing age of 27 years. The average team age of the last four World Cup winners was 27 (Australia, 1999), 28 (England, 2003), 27 (South Africa, 2007) and 28 (New Zealand, 2011). Of that group, the All Blacks held the most caps with 709, followed by South Africa with 668, England 638, and the 1999 Wallabies with 622. The trend is clear: experience matters. (Emphasis added.)
This journalist has followed a common line of thinking, which goes like this: these are some characteristics of people who have succeeded in the past; if we copy them then we’ll be just as successful. So you need a squad with an average age of 28 that has the most caps you can get. Sorted.
Here’s how the Hulk responded when he read the Guardian article.

By looking just at the winners, the journalist hasn’t checked himself with a simple, obvious question, which is, “What were the ages and caps of the teams that didn’t win the World Cup? Were they any different from the team that won?” He’s been guilty of survivorship bias – just looking at characteristics of successful people, assuming that those characteristics must be what made them successful, and not checking whether they did anything different from what the unsuccessful people did. He’s made a ton of other logical mistakes, but we’ll concentrate on this howler.
Does Average Age Matter?
We’ll start with how old the winning team needs to be, and the assertion that 28 is the magic number. Here’s the average age of the major nations at the World Cup in 2011, which New Zealand won[1].
- 26 – Australia, Wales
- 28 – NZ, Scotland, England, Ireland, S Africa
- 29 – France
So most teams had an average age of 28, and all but one of those teams didn’t win the World Cup. If I wanted to ram things home with some random analysis, I’d say that teams that didn’t have an average age of 28 did better than those that did. France (average age 29) came second, Australia (average age 26) came third, and Wales (average age 26) came fourth. All the others with average age 28, except NZ and Scotland, lost in the quarter finals. Scotland didn’t qualify from the group. I doubt that Tonga, average age 29, were bemoaning their excessive age as the key reason they didn’t take home the silverware.
Just so we’re not deceived by averages, the age difference between the oldest and youngest player in these teams ranged from 10 years to 15 years. Rather than coaches nurturing a cohort who reach 28 at the World Cup, it seems that players peak in their mid to late 20s but that coaches choose their best players for each position, even if they’re much older or younger. We’ll come back to this issue of having the best players once we’ve looked at whether having lots of caps is important.
Do More Caps Mean More Success?
Here’s an analysis of how caps affected 2011 Rugby World Cup success. I’ve given all the quarter finalists a placing of 6th (halfway between 8th for being the worst quarter finalist and 4th for being the worst semi finalist), and Scotland 10th (just missed out on quarters by coming third in its group).
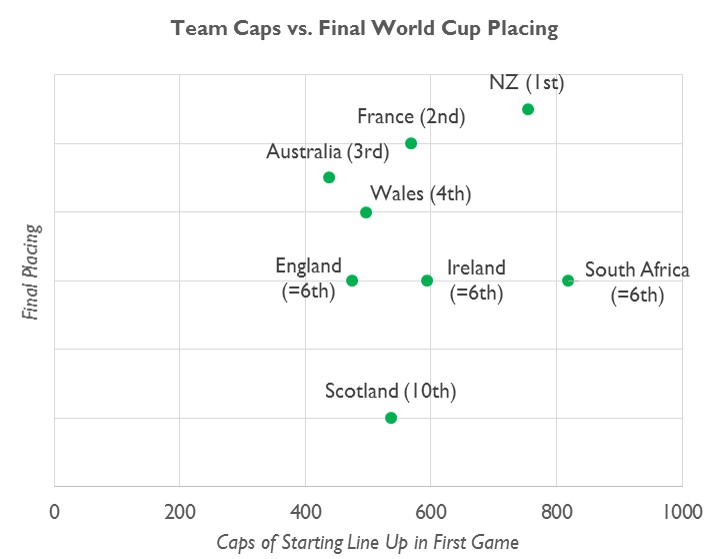
Can you see the relationship between caps and placing? No? That’s because there isn’t one. This scatter chart has an R-squared (a measure of correlation between two variables) of less than 0.02, which is pretty much the same thing as being random. Even the most hopeful, biased analyst would be embarrassed about claiming a relationship that has an R-squared of anything less than 0.5. If you do a similar analysis using matches won instead of placing, you get the same non-relationship.
The lesson from all this is that you can find yourself down some blind alleys if you just look at snippets from success stories to show you what to do. You need to think about it properly. So put down that millionaire, gold medallist philanthropist’s autobiography, take off your rose tinted glasses, and look beyond the top of the podium to see what actually distinguishes successes from failures.
What Does Seem to Matter?
I’m not going to stop here and leave rugby fans hanging by ending on what doesn’t matter. I don’t pretend to know for sure exactly what creates World Cup success, and I’m not going analyse what I suspect in this article; but here are a few facts that give us some hints:
- Since IRB rankings began in 2003, the top ranked team in the world has always won the World Cup (England in 2003, S Africa in 2007, and New Zealand in 2011), i.e. nothing magical happens at the World Cup to stop the best team winning it
- Since the World Rugby Player of the Year awards started in 2001, the country with most winners and nominations in the years since the previous World Cup, and including the World Cup year, has always won the World Cup.[2] (S Africa tied with NZ for nominations in the years leading up to 2007, which S Africa won)
- The U21 World Rugby Championship was the earliest junior world cup, and began in 2002. The team that won it 2 out of 3 times between 2002 and 2004, in that magical 7-9 years before players hit their late 20s at the 2011 World Cup, was, yes, New Zealand
- Home advantage does count, but not as much as being the best team in the world. Southern hemisphere teams are typically ranked higher than Northern, and have won 6 of the 7 World Cups to date. No Northern hemisphere team has won a home World Cup. New Zealand won both times it hosted, and South Africa won the one time it hosted. Of the Southern hemisphere World Cup hosts, only Australia hasn’t won: it lost in the final in extra time against the then top ranked team in the world, England
- Finally, it’s sport, so there’s always randomness around the edges that can make a big difference to individual matches: different weather suits different teams, referees have different interpretations, players have good and bad days, players are binned or not binned on marginal calls, game plans come off or bomb, key players get injured, and the officials miss the odd forward pass
What I take from this tiny sample of data is that the best team is made of the best players, and those players are created at least a decade before the World Cup. If you’re there or thereabouts with player quality, then you’ve got an even better chance if you’re playing at home and have a bit of luck. So it strikes me that the most important people in your country’s World Cup attempt are the people organising youth policy and player development, and the commercial team bidding to host it.
Of course, before affirming this as anything more than a supposition, I’d want to analyse it properly.
[1]I’ve used the starting line up from the first game for each team, so I’m not tempted to select matches arbitrarily. I’ve also included only the teams from the original Tri Nations and Five Nations, because I want to have a level playing field when analysing caps later.
[2] In my analysis, I gave winners double the weighting of other nominees, but that doesn’t affect the result